

Construction & Risk Evaluation Tool
A leading construction expert company who specializes in evaluating damaged structures requested our design expertise in creating a living webpage for their evaluation reports. While they have a highly regarded reputation in the industry, they were worried about staying ahead of the curve and constantly prioritize how to best serve their clients and expand their reach.
They had the idea to make their reports more interactive and flexible to constant updates. Their team also had the realization that if they could find a way to provide underwriters, the people who actually write those policies and measure the risks that are being insured, that the potential growth was exponential! Leading to an additional platform targeted towards that subset group.
Role
UX Designer, Information Architect
Date
Dec 2024 - Oct 2025
DiscoveR
Project Guidelines and Concept
This project was a little different from our usual ones. Instead of redesigning an existing webpage or product, we were tasked with converting their evaluation documentation into a living document. The time constraints were also quite tight, as this would be a quick turnaround for a presentation to the higher ups to gain funding for the product. Thankfully, their team had been thinking of this idea for awhile so their passion and extensive knowledge was a huge help in defining goals.
Why was it necessary if they were already successful?
In order to stay a leading competitor in the field, this company needed something to set them apart from the standard they had already set. Other companies had copied their documentation and delivery style over time, so they were worried for the future of their company. They had loyal customers, but new prospective clients did not know why they should trust their company over their competitors.
What prompted this?
Their team realized there was a subset of users that were not being considered. Underwriters are the key users who determine the estimates for the insurance policies based off the possible risks. The biggest issue for clients are costs! Current programs used are providing inaccurate data, leading to money loss because premiums are estimated too low for damaged structures. For example, 75% of commercial buildings are underinsured by 40% or more.
DEfine

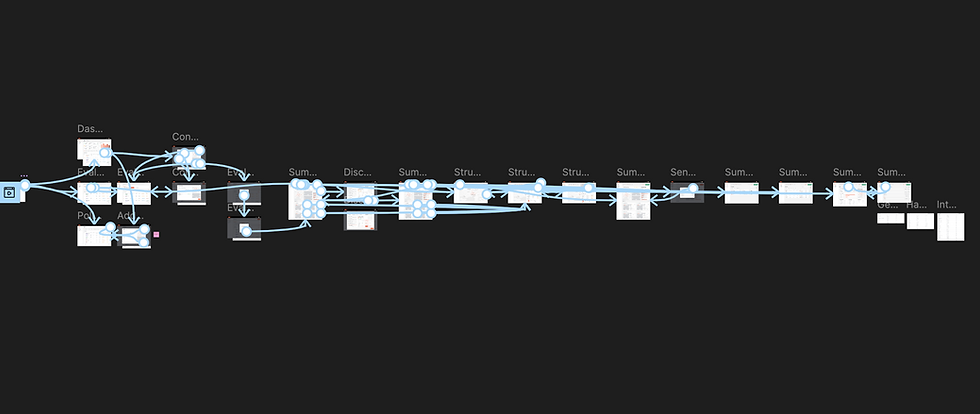
User Flows
The main target group is a new client base for them: the underwriters. Typically they work with the insurance claim department, but underwriters are the ones accessing the risks.
Other groups to consider were:
-
Risk managers
-
Insurance brokers
-
The insured
-
Their own evaluation team

Identify Pain Points
The toughest challenge for an underwriter is getting accurate values based on the outdated information they are provided. Generic estimating tools lead to generic estimates and cannot account for all of the types of construction or risks.
Also, the insured or owner is often responsible for providing the building info but either do not want to be forthcoming because of higher costs or are not knowledgeable about the details of their structures. There are also constant inflation and fluctuating costs that are not being properly accounted for, such as weather and the economy.

Review Documentation & Deliverables
-
A workflow to obtain construction costs
-
A saved record of building info and costs in the platform
-
A deliverable that can be exported
-
An audit trail for the user / insurance company to see where values were changed
-
Ability to build portfolios of all items in the system and monitor them in a generalized dashboard
IDEATION
01
Wireframing
We began wire-framing out the main pages of the platform based on the defined deliverables. We tested and reviewed many different options, especially for the more complicated aspects like the building maps and how to intersect that with data values and inputting additional risks. Which data values were high level and what could be collapsible?


03
Mid to Hi-fi
To show the evolution of the story we were creating, we created a delivery document comparing the wireframes to their hi fidelity counterparts. This helped discussion of what translated well and what still needed to be refined now that all elements were on the page. This was particularly important for large data tables that were generalized at the wireframe level.
02
Internal Review
The wireframes were refined based off real examples of their damage assessment documentation. We wanted to keep the integrity of the data visualization they had honed as a company while still making it a little more usable through filtering, clickable items, and connection throughout the product.

PRototype
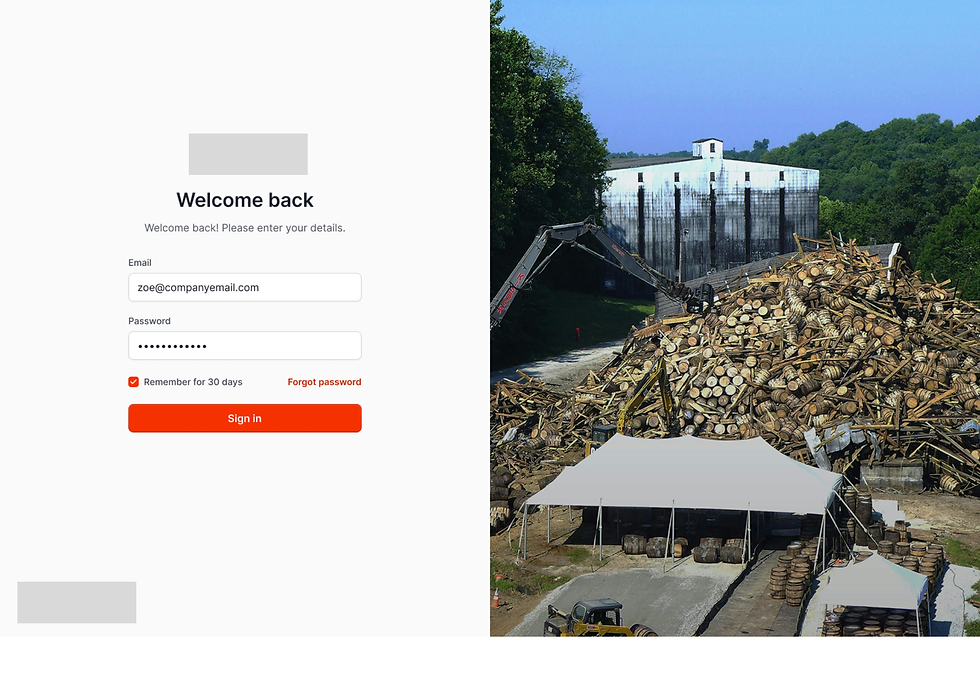
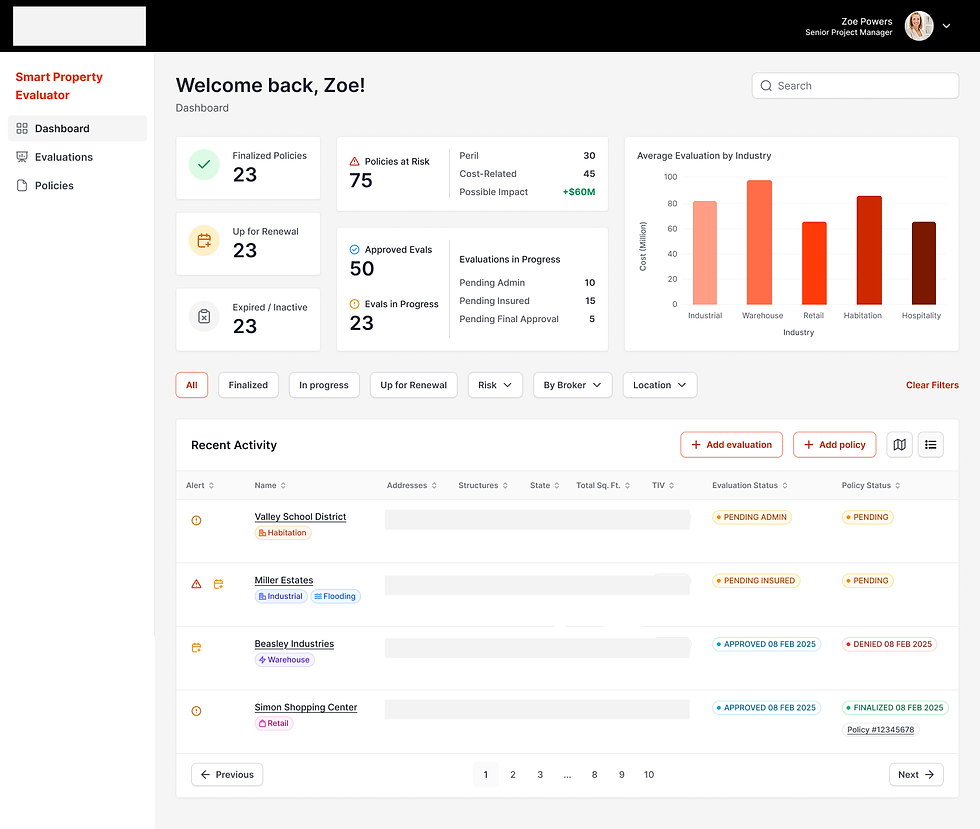
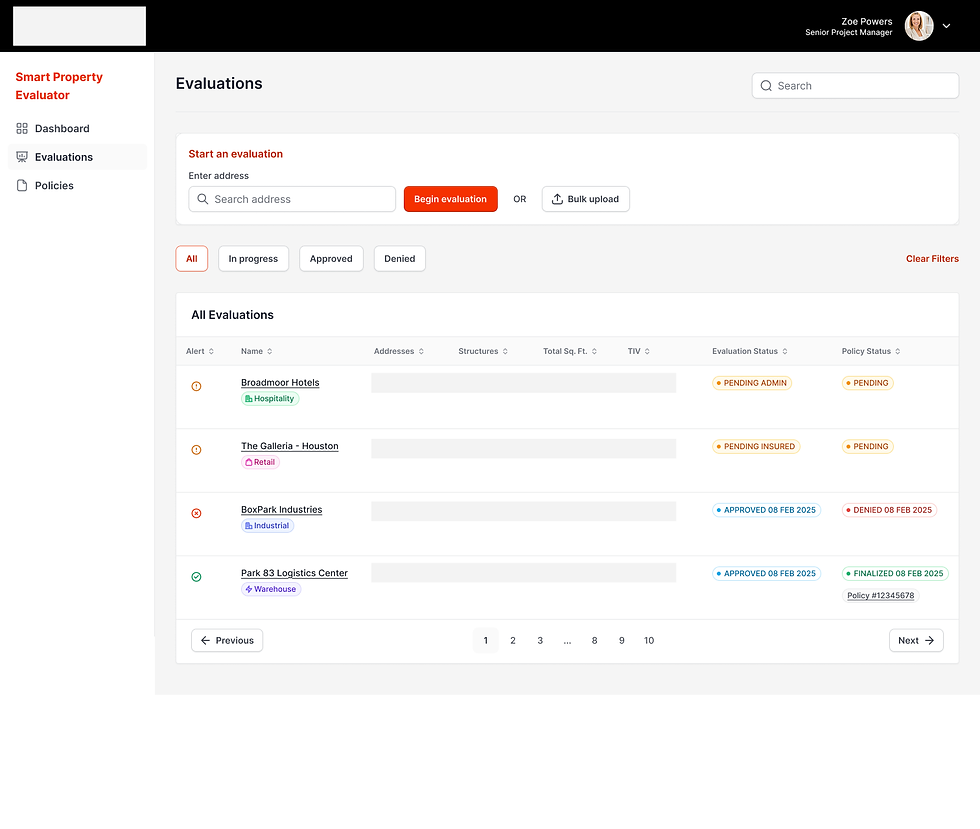
We created two prototypes for delivery, one for smart property evaluations and one for building damage assessment reports. The first was aimed towards the underwriters to manage their list of possible construction evals and their statuses. The other was aimed at evaluations that had already been valued and sent to the company after damage, such as a natural disaster, had occurred.
![[Internal Review] 2-Factor Authentication 12.7.22.png](https://static.wixstatic.com/media/0d89d0_c10700c57b8542ae906163c78066a184~mv2.png/v1/fill/w_980,h_705,al_c,q_90,usm_0.66_1.00_0.01,enc_avif,quality_auto/%5BInternal%20Review%5D%202-Factor%20Authentication%2012_7_22.png)

.png)



Testing & Analysis
What was successful?
Both prototypes received amazingly positive feedback with stakeholders very excited for the future of the product. The company had always been a leader in data visualization and had expressed this idea, but had not been able to visualize it to this extent before. We were able to maintain the branding of the company while also converting it to a web-based platform.
What was confusing?
While we had considered each of the deliverables, we realized that there was a bit of a disconnect with how to deal with reviewing the document in real time. These had to be reviewed and approved by multiple people at different times and we were still having a little difficulty conveying that without additional context.
What was surprising?
The lack of accurate information about structures was unexpected to hear, especially for an industry so focused on regulation. We realized there were many opportunities for how to improve, including real-time updating from drone capture, the product being linked to portable tablets, and accountable status updates on fresh assessments.
What still needs work?
Due to the fact that this was not a prioritized project by the higher ups, the prototypes were only able to be presented in a limited amount of time during the meeting. Luckily, our work did make a lasting impression even in that short amount of time, which was very flattering to hear. We would have loved to dive deeper on all types of structures and how they would be displayed, especially for aspects like the sitemap and how it was meant to connect across the product.

Final Thoughts
What did I learn?
Working with this team, a group of people so passionate about their product and potential future, really helped me regain my own passion for my work. Sometimes projects can become so monotonous, leading to burnout or a lack of creative productivity, but this one felt like a collaborative hub of people ready to come up with solutions and open to the possibilities of how things could revolutionize their industry.
I also learned the importance of parsing feedback from review meetings immediately, whether individually or with your team. While it is tempting to believe that you will be able to remember and oftentimes there is a recording to go back to if you do forget, reorienting yourself with your new action items while it is fresh on your mind saves you so much time in the long run. What can I do to make my life easier tomorrow?